Logging and monitoring traffic consumption using VnStat
Installing VnStat from the repository
The VnStat package can be installed from repositories as well as from source code. Let's consider both options and start with the simplest - repositories. There are several installation differences depending on the distribution family.
Debian based distros
In distributions based on Debian Linux, installation is performed using just one command:
sudo apt install vnstat

The utility is quickly installed, the service automatically starts and adds to autorun. Let's check the status:
sudo systemctl status vnstat

RHEL based distros
1. Enable the Epel repository
sudo yum -y install epel-release
Next, update the information about available software in the repository
sudo yum -y update

2. Install VnStat
sudo yum install vnstat

3. To start using the utility, you need to run it as a service. During the first launch, a database will be created in which traffic consumption logs will be recorded:
sudo systemctl enable vnstat | sudo systemctl start vnstat
4. Check the status after starting the service
sudo systemctl status vnstat

The utility is ready to use. However, upon first launch, a dialog message will appear indicating that there is not enough data to display yet. We are waiting for statistics to be collected. Logging of traffic consumption will begin from the moment the utility is installed.

If the epel-release repository is no longer needed on the server, it can be deleted with the command:
sudo yum -y remove epel-release
The utility configuration file is located at /etc/vnstat.conf An important parameter in it is the interface on which traffic consumption statistics are planned to be collected. This is relevant for systems with several network interfaces. In the section with examples of basic functions, we will look at how you can set a parameter indicating the interface.
Installation from source code
1. Install the additional software required to build the package
For RHEL and CentOS
sudo yum group install "Development Tools"
Confirm by entering "y"
sudo yum install gd gd-devel sqlite-devel
Confirm by entering "y"
For Ubuntu and Debian
sudo apt install build-essential libsqlite3-dev
Confirm by entering "y"
2. Download the source code archive
wget https://humdi.net/vnstat/vnstat-latest.tar.gz
3. Unpack the archive
tar -xvf vnstat-latest.tar.gz
4. Check which version of the package was downloaded and what the name of the unpacked folder is
ls

5. Go to the vnstat-x.xx directory (where x.xx is the version of the utility and part of the name of the folder you unpacked)
cd vnstat-2.11
6. Start building the package and wait for the installation to complete
./configure --prefix=/usr --sysconfdir=/etc && make && make install
When the installation is complete, you will see a message

7. You need to copy the template and start the vnstat daemon:
sudo cp -v examples/systemd/vnstat.service /etc/systemd/system/
sudo systemctl enable vnstat | sudo systemctl start vnstat
8. Check the status to make sure the service is working
sudo systemctl status vnstat

Examples of using VnStat
Check the list of available interfaces to select the one on which you want to check traffic consumption statistics. Use a simple command to view configured IP addresses
ip a

We see that we have an external IP address assigned to the ens3 interface. In the examples we will use this interface.
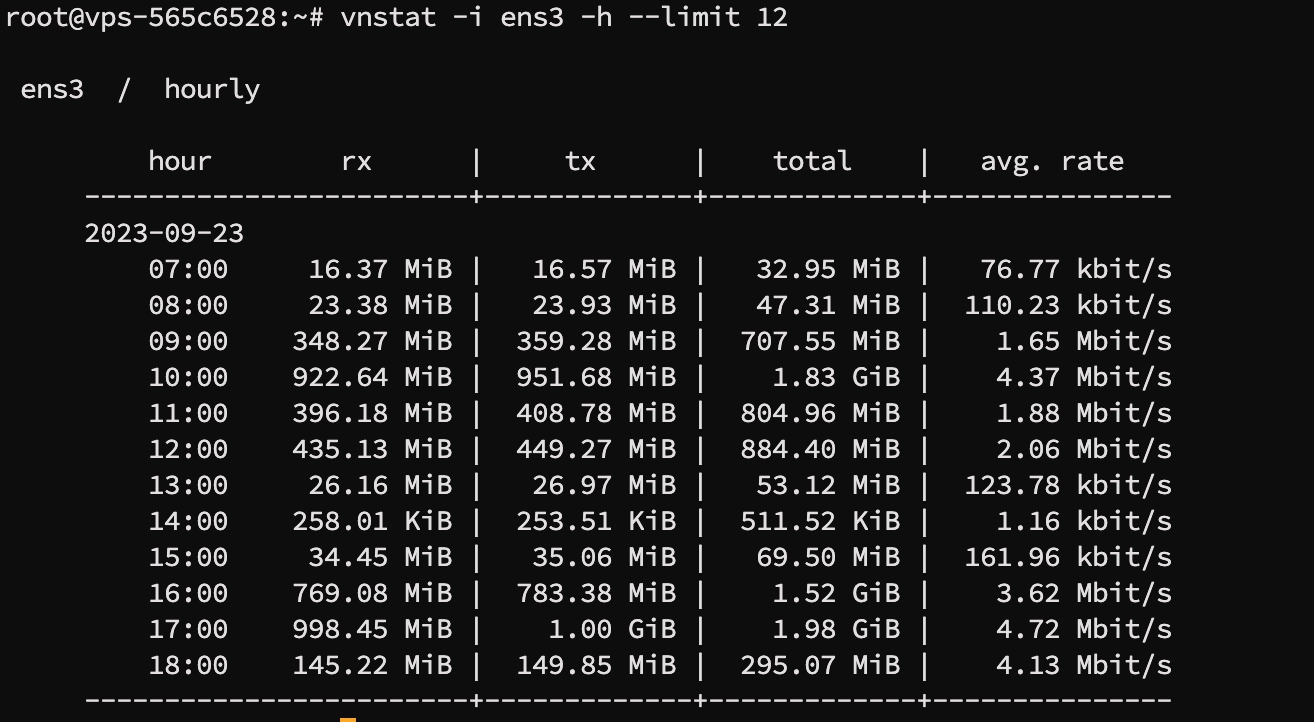
Checking traffic consumption in the list by hour
(the --limit option allows you to limit the number of hours displayed. In the example, information for the last 12 hours is displayed):
vnstat -i ens3 -h --limit 12

Checking traffic consumption in the list by day
(the --limit option will limit the number of days displayed. In the example, we will display the last 2 days):
vnstat -i ens3 -d --limit 2

To highlight days with the highest traffic consumption, you can use the -t option

Checking traffic consumption in the list by month
(the --limit option will limit the number of months displayed):
vnstat -i ens3 -m

Checking traffic consumption in the list by year
(the --limit option will limit the number of years displayed)
vnstat -i ens3 -y

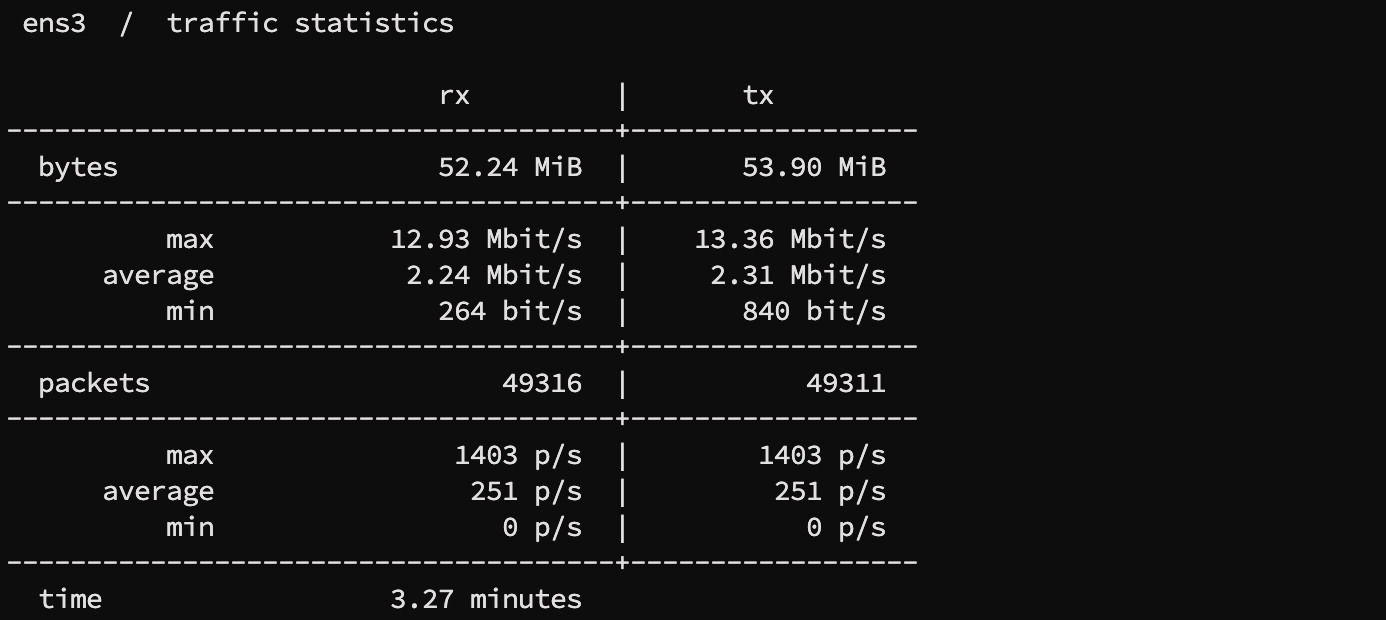
Check traffic consumption in the list in real time
vnstat -i ens3 -l

After interrupting the process, we will obtain a table of values for the time during which the measurement was carried out

Checking the traffic consumption in the list in a given period of time in seconds
vnstat -i ens3 -tr 20

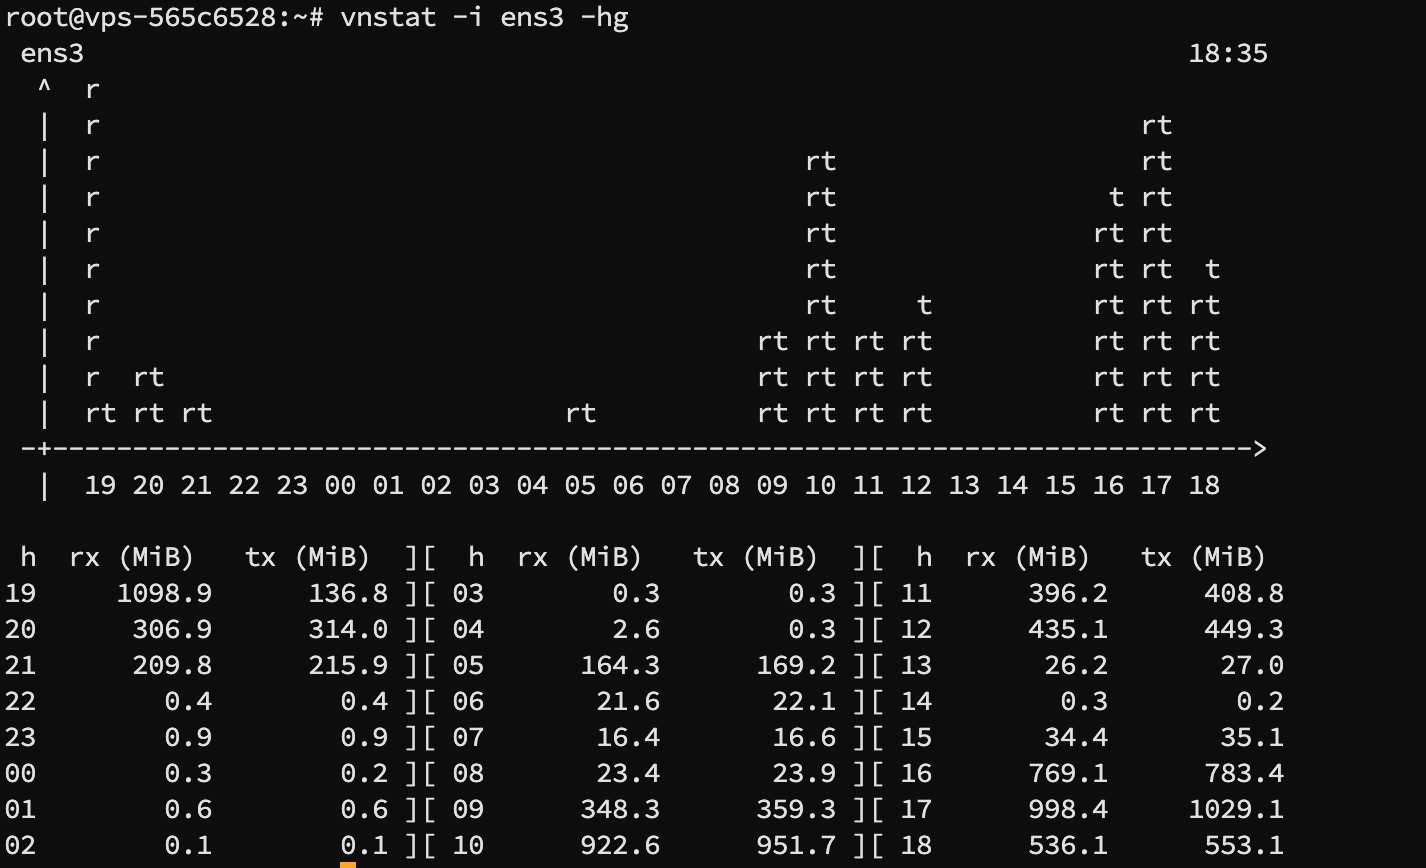
Displaying a graph showing traffic consumption over the last 24 hours
vnstat -i ens3 -hg


