

Diagnosing high load on a VPS
Using htop, top, and iotop-c to find the guilty process
When your VPS starts to lag – SSH feels delayed, websites respond slowly, or even typing in the terminal seems sluggish – it usually means one or more system resources (CPU, RAM, or disk I/O) are being pushed to their limits. This guide walks you through a practical, step-by-step process to identify what's happening and which process is to blame, using three standard Linux tools: htop, top, and iotop-c.
The audience is assumed to be beginner-to-intermediate sysadmins familiar with the command line and basic Linux concepts.
Step one: Know what "high load" actually means
Many people see a high "load average" and panic – but not all high loads are bad. Let's clarify this.
What is the "load average"?
The "load average" tells you how many processes are waiting for the CPU at a given time. It's shown as three numbers (for the past 1, 5, and 15 minutes).
Example: uptime
Output:
17:41:25 up 2 days, 3:45, 1 user, load average: 2.34, 1.89, 1.42
Interpretation:
- 2.34 – average load in the last minute
- 1.89 – in the last 5 minutes
- 1.42 – in the last 15 minutes
Now, compare those numbers to your CPU core count. If you have 2 cores:
- Load around 2.0 means both CPUs are fully used – the system is busy, but fine.
- Load much higher than 2.0 (like 3 or 4) means there's a queue – too many processes are waiting.
Check how many cores you have:
nproc
If load ≫ number of cores for a long time, it's time to investigate.
Step two: Get a quick overview with htop
htop is the easiest way to visualize what's going on inside your VPS in real time.
Install htop
Use command suitable for your linux distribution to install:
sudo apt install htopfor Ubuntu/Debiansudo yum install htopfor CentOS/RHEL
Run it
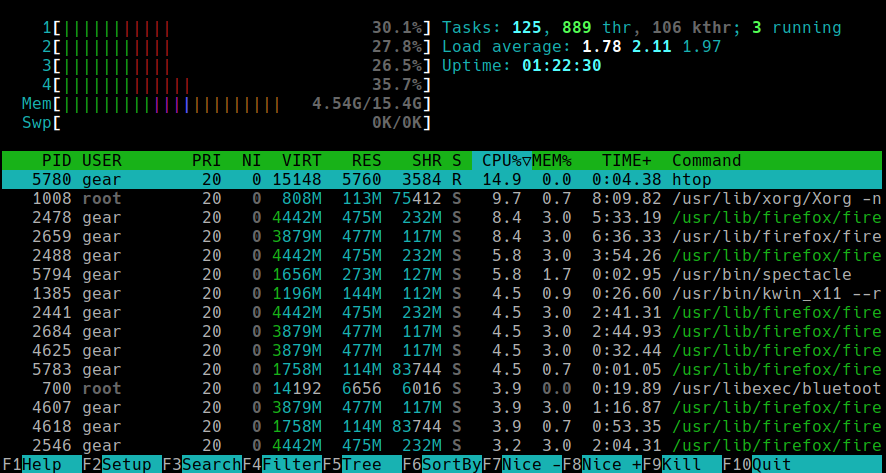
Run htop command. You'll see a colorful interface like this:
Understanding the layout
- Top bars show CPU, memory, and swap usage in real time.
- Load average is visible in the upper-right corner.
- The process list shows what's running and how much CPU and RAM each process uses.
Navigation tips
- Sort by CPU usage: press F6, then choose "PERCENT_CPU"
- Sort by memory: press F6, choose "PERCENT_MEM"
- Tree view (show parent/child processes): press F5
- Kill a process: highlight it – press F9 – choose signal (default is 15, "terminate")
- Search for a process: press F3, type part of its name (e.g., "nginx")
What to look for
- Processes with high CPU% – these are consuming most CPU time.
- Processes with high MEM% – these are consuming RAM and may be forcing the system to swap.
- If a process keeps reappearing at the top every few seconds, it might be a looping script or restarting service.
Example
Run htop. If you see something like:
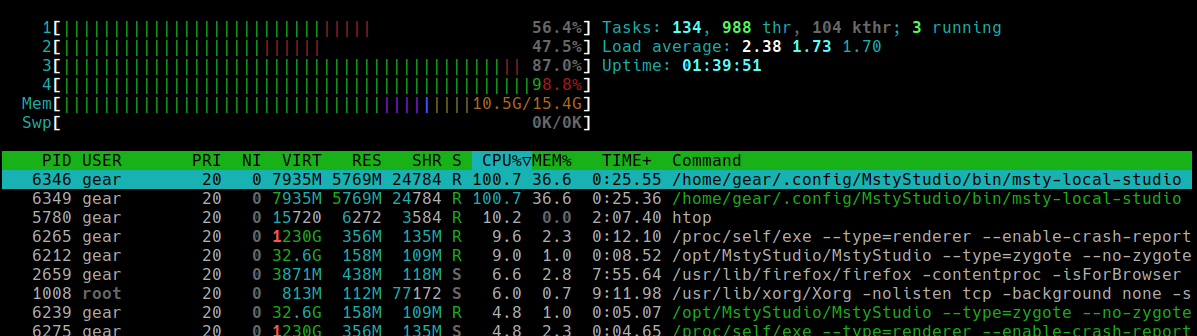
It's clear that msty-local-studio with PID 6346 is using more CPU and memory than everything else. Now you know where to focus your next checks.
Step Three: Cross-check with top
While htop is friendly, top is available on every Linux system – no installation required. It's a good fallback when you only have SSH access to a minimal environment.
Run it
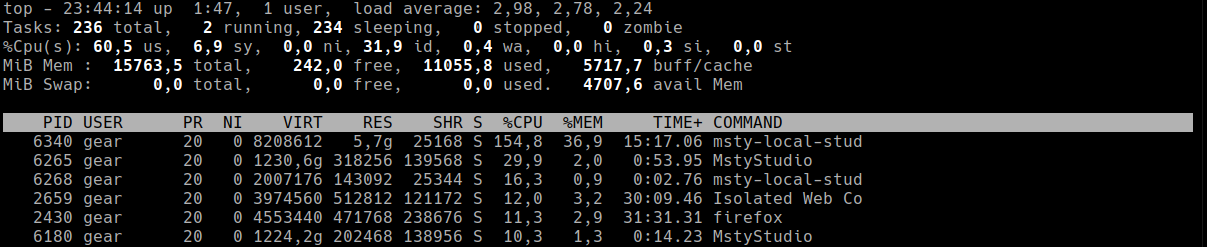
Run top command. You'll see an interface like this:
Key points
- %Cpu(s) line shows where CPU time goes:
- us – user processes
- sy – system/kernel tasks
- wa – waiting for I/O (disk)
- %wa (I/O wait) above 10–15% often means a disk bottleneck.
- Load average and tasks summary tell you how busy the system is.
Useful keyboard shortcuts
- Shift + P – sort by CPU
- Shift + M – sort by memory
- Shift + T – sort by process run time
- 1 – toggle per-core CPU usage
- k – kill a process (enter PID when asked)
- q – quit
top
When to use top
Use top when:
htopisn't installed (like on a rescue system or Docker container).- You want a light tool that shows CPU vs. I/O balance in real time.
Step Four: If CPU and RAM Look Fine – Check Disk I/O using iotop-c
Sometimes everything looks normal – CPU usage isn't high, memory is okay – yet the system feels frozen. Commands like ls or cd hang for seconds, and the load average is still high. That's a classic sign of I/O wait, where the CPU is idle but waiting for disk operations to complete.
Install iotop-c
Use command suitable for your linux distribution to install:
sudo apt install iotop-cfor Ubuntu/Debiansudo yum install iotop-cfor CentOS/RHEL
Enable IO monitoring using command:
sudo sysctl kernel.task_delayacct=1
Run it
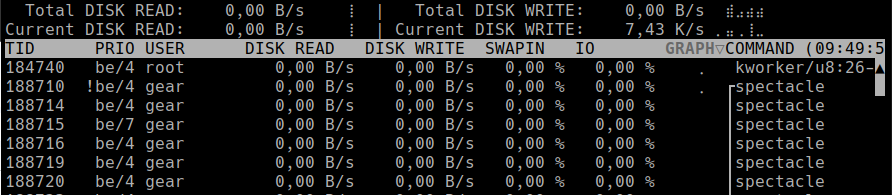
Run command as root user: sudo iotop-c. You'll see an interface like this:
Interpretation
- IO column shows how much time each process is blocked waiting for I/O.
- High IO (e.g., 90–100%) – that process is waiting heavily on the disk.
- Check if you're running backups, large data imports, or compression jobs.
Common causes of I/O overload
- Database (
mysqld,postgres) running a large query. - Backup scripts (
rsync,tar,dd) copying massive files. - Log files growing uncontrollably in
/var/log. - Misconfigured swap – if the system starts swapping heavily, it thrashes the disk.
Step Five: Correlate What You Found
Now that you've used htop, top, and iotop-c, it's time to put the puzzle together.
| Symptom | Likely Cause | Tool to Check |
|---|---|---|
| High CPU usage | Buggy script, heavy process | htop, top |
| High memory usage | Memory leak, too many workers | htop |
| High I/O wait, slow response | Disk bottleneck, swapping | iotop-c, top |
| High load but CPU idle | I/O or memory exhaustion | top, iotop-c |
Also, check system logs for warnings:
journalctl -xe
or:
tail -n 50 /var/log/syslog
You might find messages about kernel errors, failed mounts, or processes being killed by the OOM (Out Of Memory) killer.
Step Six: Take Action
Once you identify the culprit, decide what to do next.
Restart or stop the process
sudo systemctl restart <service>
or, if necessary:
sudo kill -9 <pid>
Free up disk space
If disk usage is high, use df -h to determine which partition to clean up, or sudo du -sh /var/log/* to determine which logs to clean up.
Reduce process load
- Limit cron jobs so they don't run at the same time.
- Adjust database query limits or caching.
- Reduce worker count in Nginx, Apache, or Gunicorn.
If nothing helps – upgrade resources
If you constantly hit limits even with optimized workloads, it's time to add more CPU, RAM, or switch to faster storage (e.g., SSD to NVMe).
Step Seven: Prevention and Continuous Monitoring
You shouldn't have to manually log in and check load every time. You can set up monitoring and alerts with tools like: glances, netdata, prometheus, etc.
Quick Reference Commands
| Goal | Command |
|---|---|
| Show load average | uptime |
| See CPU/memory load visually | htop |
| Minimal process view | top |
| Monitor disk activity | iotop-c |
| View logs | journalctl -xe |
Real-World Example: The Runaway Backup Script
Let's put everything together with a real scenario.
Situation
- VPS with 2 CPU cores and SSD storage
- Suddenly feels very slow – SSH lag, web pages timeout
uptimeshows: load average: 8.5, 7.3, 6.9 – way too high for 2 cores.
Investigation
- Run
htop: CPU usage is low – only 10–15%. Memory usage is fine. So not CPU-bound. - Run
top: %wa = 40% – system waiting on disk I/O. - Run
iotop-c:
Bingo – a backup script compressing a huge directory directly on disk.
Fix
- Stop or reschedule the backup to run at night.
- Compress to
/tmp(in memory) before moving to disk. - Use
ioniceto reduce its disk priority.
Result
VPS performance returns to normal instantly.
Final Thoughts
Diagnosing high load isn't magic – it's about systematically checking CPU, memory, and disk one by one. Use your tools like a detective:
- Is the CPU maxed out? –
htop,top - Is memory full or swapping? –
htop,top - Is the disk overloaded? –
iotop-c - Logs confirm it? –
journalctl
Once you identify the guilty process, you can decide: tune it, kill it, or schedule it better. Over time, you'll start recognizing patterns – a heavy load process, too many cron jobs, or a misconfigured web app. That's when you stop firefighting and start managing like a real sysadmin.